Website monitoring with Zabbix
Requirements
Minimum required Zabbix version is 7.0.0, however the instructions here were tested on version 7.2.3 installed with Docker containers (zabbix-server-pgsql).
Install WebDriver
Selenium standalone-chrome @ Docker Hub
Create a new docker compose file for Chrome. I’ll be adding Chrome container to the same network as Zabbix server. This allows me to specify the WebDriver IP address for Zabbix server to use.
As I will be using the WebDriver within the same docker network as the Zabbix server, I am not exposing any ports for the Chrome container. To expose the Chrome externally, ports
7900and4444will need to be exposed.
Be sure to use an IP in the range of existing network. For me, the zabbix network is
172.20.0.0/24. All docker networks can be listed withdocker network lsand the subnet of the network can be checked withdocker network inspect <network_name> | grep -i subnet
1
2
3
4
5
6
7
8
9
10
11
12
13
services:
  chrome:
    image: selenium/standalone-chrome:latest
    container_name: chrome
    restart: unless-stopped
    shm_size: 2g
    networks:
      zabbix_zabbix:
        ipv4_address: 172.20.0.50

networks:
  zabbix_zabbix:
    external: true
Run the container:
1
docker compose up -d
Configure Zabbix
There is two parts to getting Zabbix to monitor a website. Firstly Zabbix needs to know the address of the WebDriver, and secondly which website and how often to monitor.
Update Zabbix server docker compose file
Default amount of browser pollers are set to 1, this can be modified by adding a new environment variable
ZBX_STARTBROWSERPOLLERSto the docker compose, specifying the amount required.
1
2
3
4
...
environment:
+  ZBX_WEBDRIVERURL: "172.20.0.50:4444"
...
Adding a website to monitor
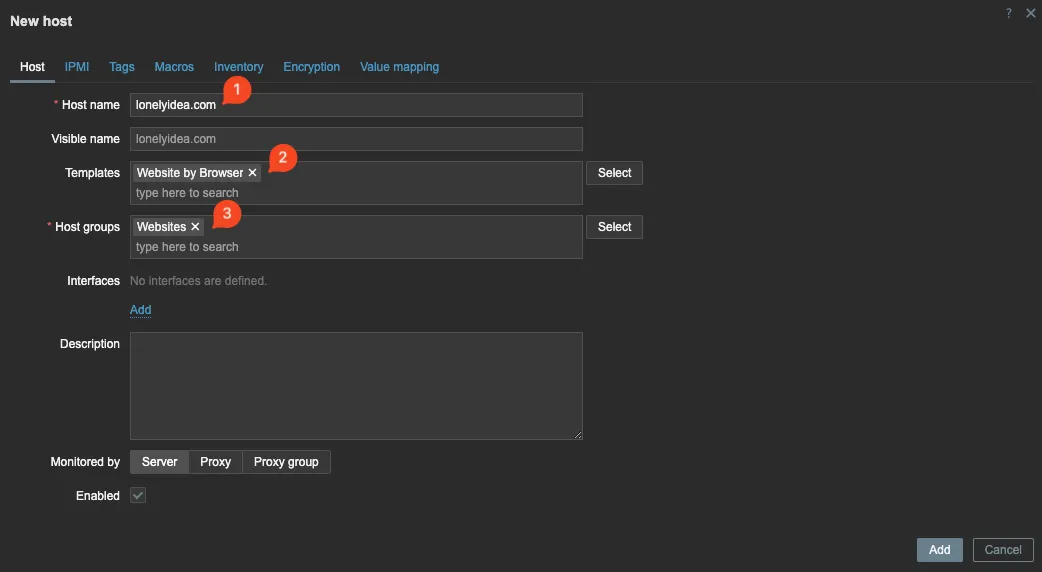
In Zabbix frontend, navigate to Data collection -> Hosts and click on Create host on top right corner.
Fill in the following fields:
Host name: lonelyidea.comTemplates: Website by BrowserHost groups: as needed (e.g. “Websites”)
Navigate to Macros tab and add two new macros:
- Macro:
{$WEBSITE.DOMAIN} - Value: Website URL to monitor (e.g. lonelyidea.com)
And:
- Macro:
{$WEBSITE.GET.DATA.INTERVAL} - Value: Choose how often the website is checked (e.g. 5m or 1h)
Optional macros:
{$WEBSITE.PATH}{$WEBSITE.SCHEME}- defaulthttps{$WEBSITE.SCREEN.HEIGHT}- default1080{$WEBSITE.SCREEN.WIDTH}- default1920
Click Add at the bottom right of the new host dialog window.
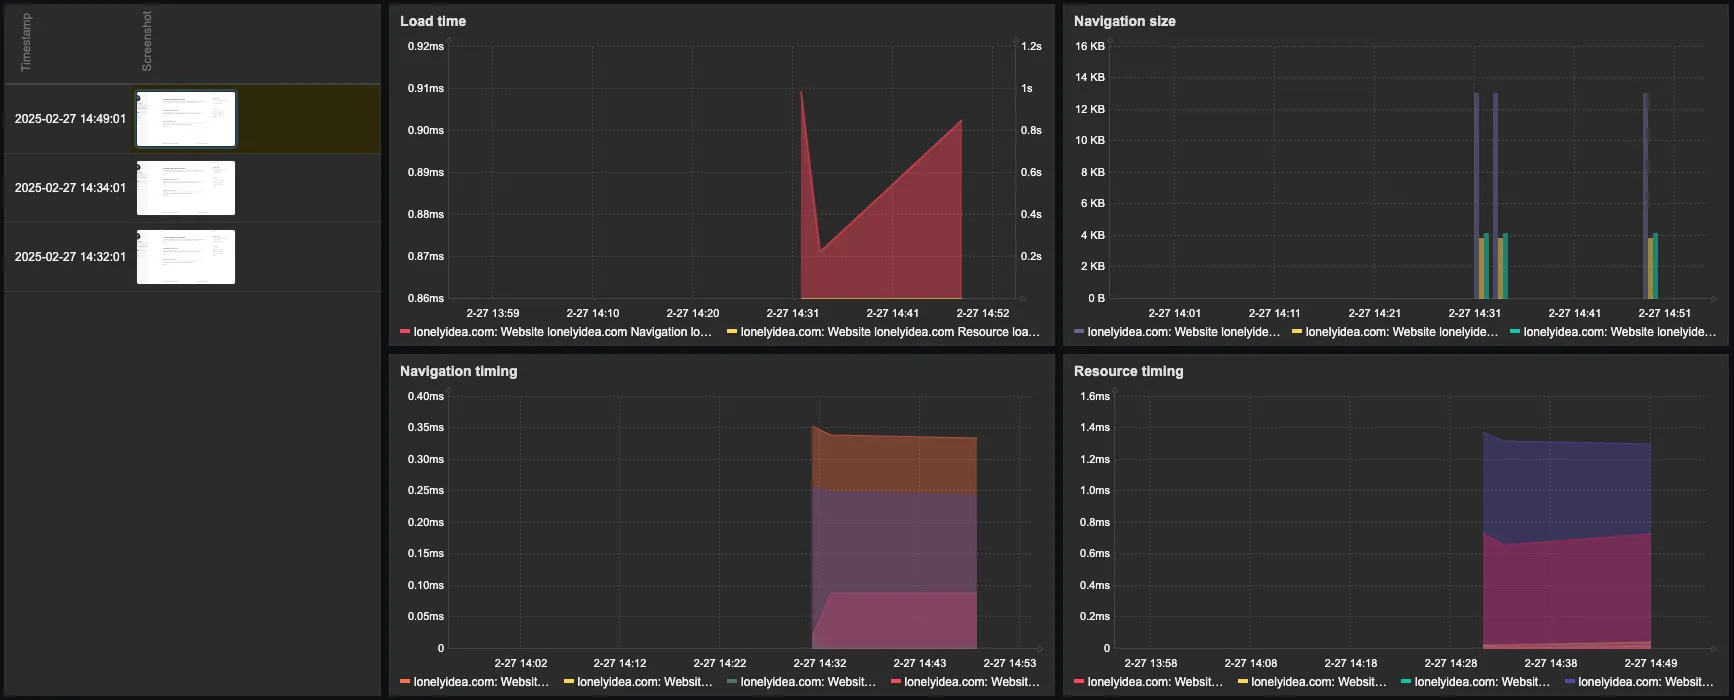
Viewing the collected data
Navigate to Monitoring -> Hosts and select Dashboards for the newly created host.


